Written by:
 Elly Mead
Within our INSPIRED blog series, we are making space to celebrate community leadership and cross-sector collaboration within design and placemaking. Through our open call for stories, ideas and anecdotes about inspired approaches to shaping buildings, open spaces, homes or neighbourhoods, we are taking the time to celebrate the connections that continue to make our places special.
The series was originally launched back in 2021 when we were still emerging from a post-covid world, but we have kept the series ongoing as the need for good news stories is never ending.
This month’s INSPIRED blog comes from a project that was introduced to us during our Building Equitable Green Futures Glass-House Chat. We were discussing ways we can encourage communities to be involved in green initiatives. This engagement can help them understand some of the crucial challenges we are facing in climate change, and allow them to understand how it is affecting their local areas in order to hold those with decision-making powers accountable.
Knitting the Air is a group of residents in Poplar, East London, who have been turning air pollution data from two nearby areas into knitting. When thinking about an issue like air pollution, which can feel intangible and hard to visualise (until levels rise very high), it can be difficult to get individuals and wider communities engaged in understanding data and then pushing for change.
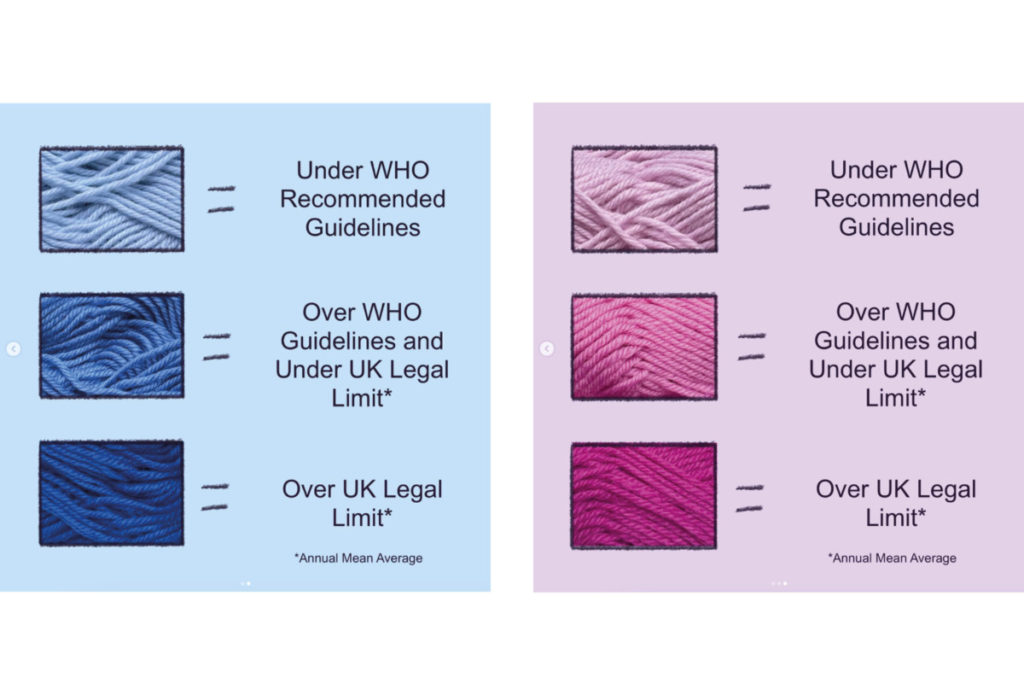
Knitting the Air has been working to tackle this by taking air quality data, both Particulate Matter (PM) which is anything in air which is a solid or liquid particle (for example dust, soot or smoke), and Nitrogen Dioxide (NO2), (a gas mainly produced during the combustion process of fossil fuels) and knitting panels to depict it. They have created a key using different shades of blue and pink, which indicate whether the measured levels of air quality data fall under the World Health Organisation’s (WHO) recommended limits, over the WHO guidelines but under the UK legal limit, or over the UK legal limit.
By giving the air data the knitting treatment, this group is visualising hard to understand data, giving it a physical presence in a familiar medium (who amongst us doesn’t own a knitted jumper, cardigan or pair of socks?). This not only draws attention to problematic air data in a way that cold numbers or graphics cannot, but can also help communities take hold (quite literally) of data which affects their lives.
The group regularly share their knitted data creations on their Instagram account:
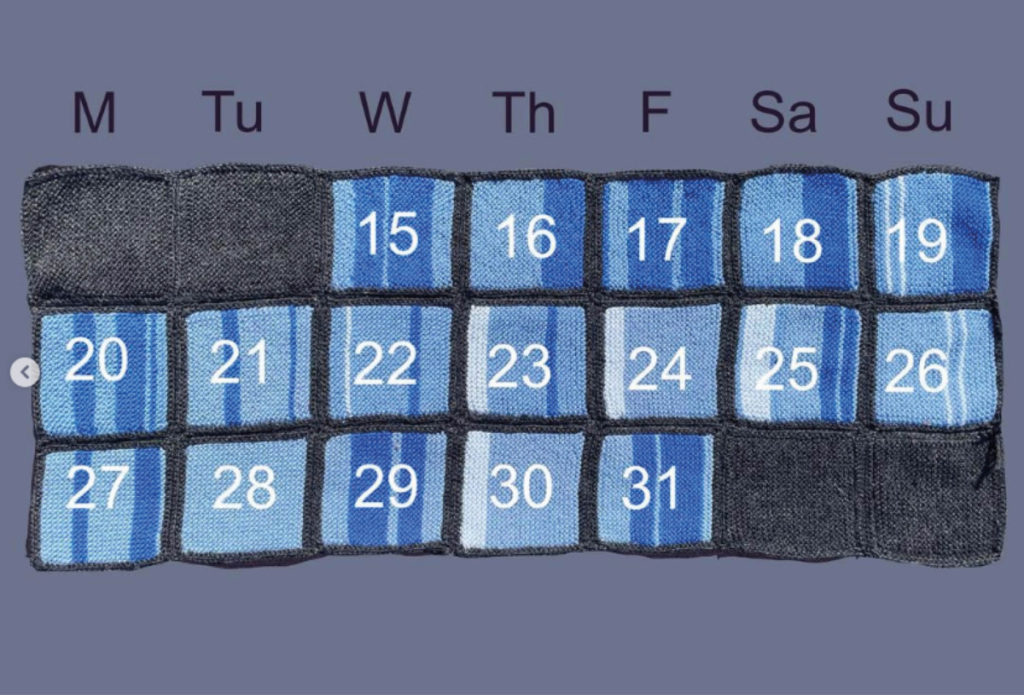
Each panel is made up of 24 coloured rows, each representing an hour in each day. Here, you can see the end three weeks in March 2023, and how the NO2 level reaches illegal limits on 11 out of the 17 days, often coinciding with rush hour.
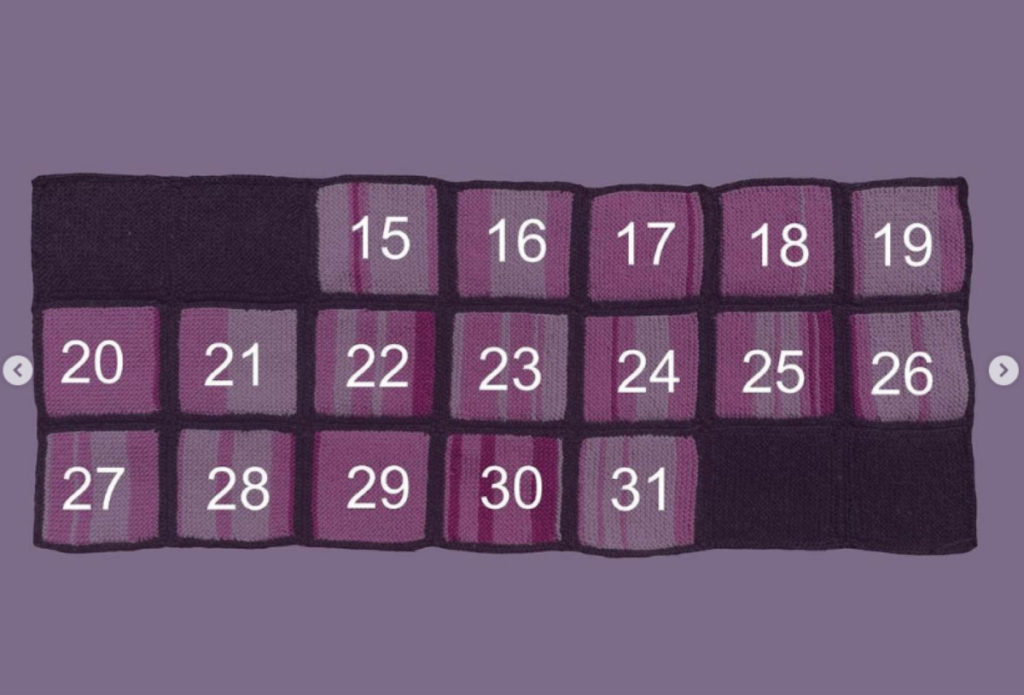
The pink version of this timeframe, measuring the PM, shows legal breaches on 10 days of the 17, but what is also noticeable in both sets of knitted data is that all the days measured over these three weeks have air pollution levels over WHO recommended guidelines for health.
Much of this data is unsurprising, given the UK’s historical breaching of legal limits, which has seen the UK government facing fines alongside legal challenges over the illegal levels of air pollution. However, seeing it in this accessible, hands-on way allows the data to create a physical impact. It is a quick and easy way to understand how healthy or unhealthy the current air pollution situation is in Poplar. Can the small act of knitting cascade to create greater change?
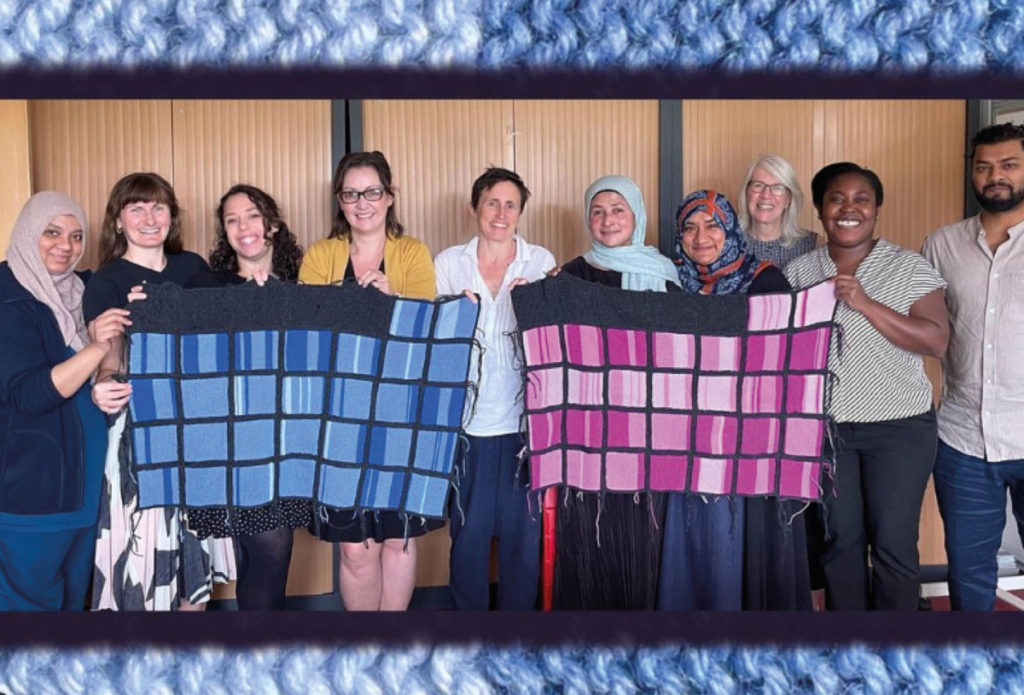
The Knitting the Air knitters have committed to tracking the data physically in this way for a whole year (having started in March 2023) and so far, over 60 knitters from E16 and beyond have contributed their knitting skills to the challenge. The group has also created a social network in Poplar, arranging Knitting Meet Ups to join other knitters and work on this huge project together.
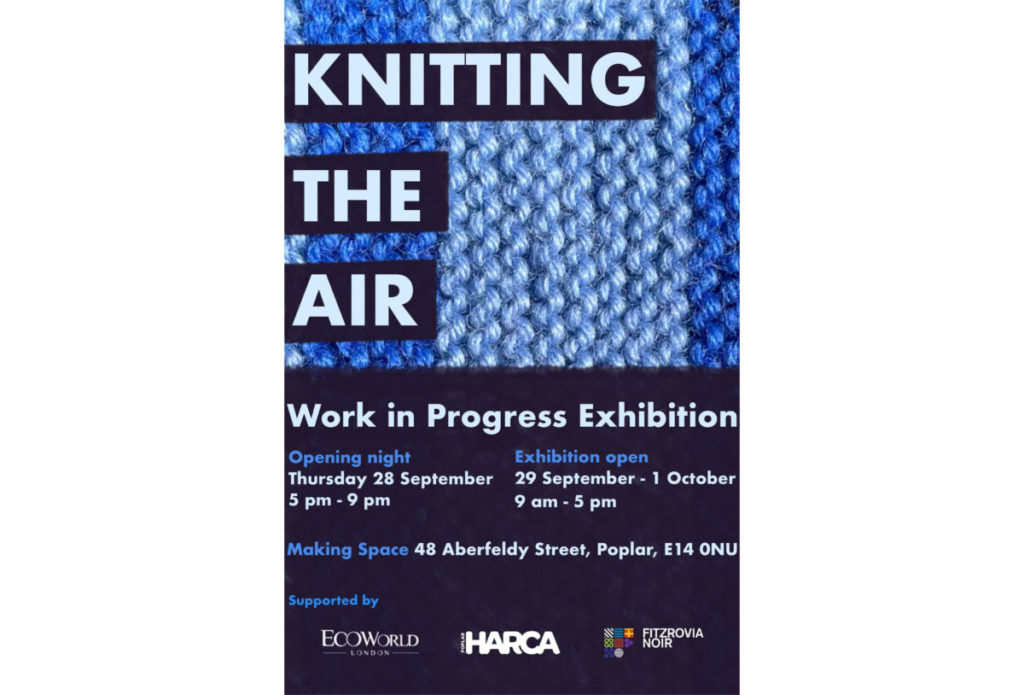
On Thursday 29 September, the group will be celebrating the progress made so far in their big knitting challenge, at their Work in Progress Exhibition at Making Space on Aberfeldy Street. The exhibition of work will be open that weekend until Sunday 1st October, and the exhibition aims to bring awareness to air pollution locally, open up conversations and spark ideas for solutions. If you’re in the area, make sure to stop by to show your support and explore the knitted data.
Knitting the Air is a beautiful example of how outside-the-box thinking can help hard data become accessible and understandable, whilst creating engaged and passionate social networks of people. It shows that small actions and the decisions that we each make, when done over and over, can accumulate into something much bigger than our individual selves. Perhaps we can each consider this when next choosing how we make a journey.